Guide · Hosting & inference
How to Benchmark LLM Inference: Tools and Method
A repeatable method for load-testing LLM serving, the metrics to report (TTFT, ITL, goodput), and vllm bench serve, SGLang bench_serving, GuideLLM and AIPerf compared.
Metarix Editorial · Nov 12, 2026 · Updated Nov 15, 2026 · 11 min read
Documentation-based research
On this page
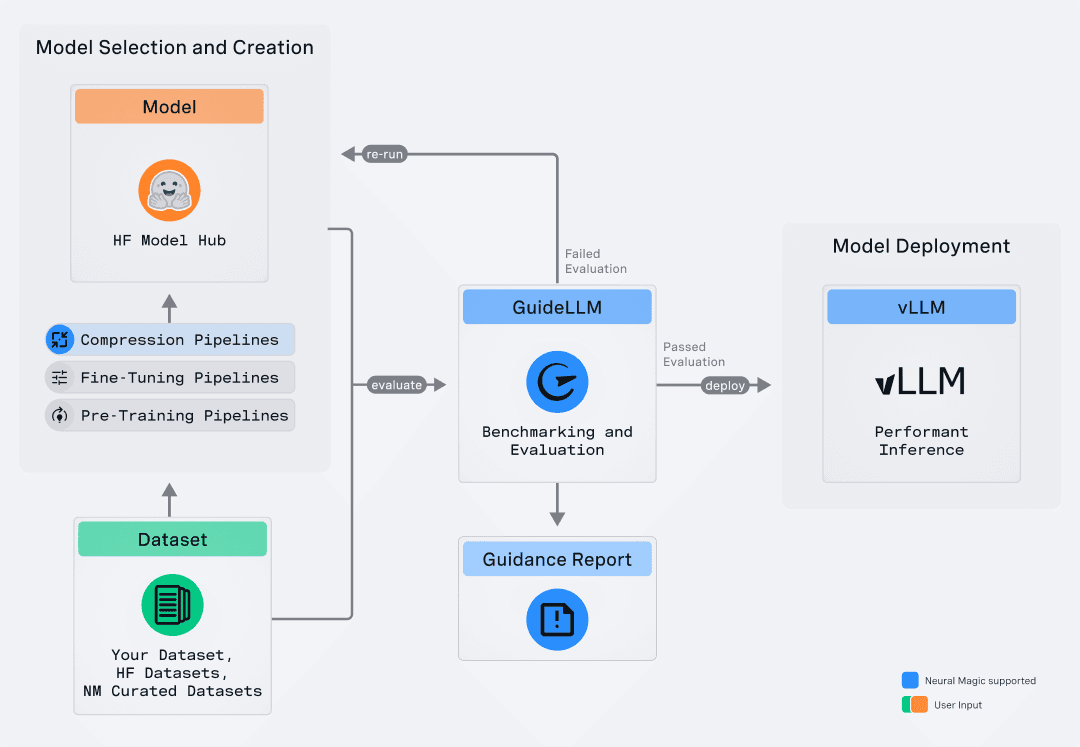
To benchmark LLM inference properly, you run a load generator against your serving endpoint with a workload that looks like production, sweep the load from one user to saturation, and judge p99 latency against your targets rather than reading a single throughput number. The tool matters less than the method, but the tool choice has shifted: NVIDIA's GenAI-Perf is being phased out in favor of AIPerf, and Ray's LLMPerf repository is archived.
This guide covers the metrics, a repeatable six-step method, the main open-source tools as of Nov 12, 2026 (vllm bench serve, SGLang's bench_serving, GuideLLM, AIPerf and Hugging Face inference-benchmarker), example commands and the mistakes that make results meaningless.
Quick answer
Use the benchmark that ships with your engine (vllm bench serve or SGLang's bench_serving) when you are tuning that engine's flags. Use GuideLLM when you need SLO-driven sweeps and shareable reports across any OpenAI-compatible server, and AIPerf when you need to replay real or agentic traffic traces or you are on NVIDIA's stack. Whatever you pick, fix the workload, warm up, sweep load, and report p50 and p99 time to first token, inter-token latency and goodput, not just tokens per second.
Scroll the table horizontally on smaller screens.
| Tool | Maintainer | Install | Load control | Stands out for | Status |
|---|---|---|---|---|---|
| vllm bench serve | vLLM project | Part of vLLM | Request rate (Poisson or gamma bursts), concurrency cap | Goodput, percentiles, many datasets, trace replay | Active, ships with vLLM |
| SGLang bench_serving | SGLang project | Part of SGLang | Request rate (Poisson), concurrency cap | Goodput and SLO attainment, cache flush, many backends | Active, ships with SGLang |
| GuideLLM | vLLM project | pip or container | Synchronous, concurrent, throughput, constant, Poisson, sweep | Saturation sweeps, HTML/CSV reports, multimodal | Active, v0.8.1 (Oct 8, 2026) |
| AIPerf | NVIDIA (ai-dynamo) | pip | Concurrency, rate, rate plus cap, ramping, schedules | Trace replay incl. agentic traces, dashboard, MLflow/OTel | Active, v0.13.0 (Sep 24, 2026) |
| inference-benchmarker | Hugging Face | Rust binary or Docker | Constant arrival rate, automatic sweep | Preset workload profiles, Kubernetes and Slurm | Last release v1.1.0 (Mar 28, 2025) |
| GenAI-Perf | NVIDIA | pip | Concurrency, rate | Older NVIDIA standard | Being phased out; use AIPerf |
| LLMPerf | Ray project | git clone | Concurrent requests | Early hosted-API comparisons | Repository archived |
The metrics that matter
Every tool here reports roughly the same core numbers. Our explainer on LLM latency and throughput goes deeper on why they move; this is the short version you need to read a benchmark report:
- Time to first token (TTFT): how long a user waits before anything streams back. Dominated by queueing and prefill, so it grows with prompt length and load.
- Inter-token latency (ITL): the gap between streamed tokens after the first one. It decides whether output feels smooth.
- Time per output token (TPOT): the average decode time per token after the first. SGLang's docs define it as (latency minus TTFT) divided by (output tokens minus 1).
- End-to-end latency: the full request time, which is what non-streaming callers and agent loops actually feel.
- Throughput: requests per second and output tokens per second across all users. It is the number vendors like to quote, and on its own it hides queueing pain.
- Goodput: requests per second that met every latency target you set. Both vLLM and SGLang can compute it from targets such as TTFT under 500 ms and TPOT under 50 ms.
Goodput is the one to anchor on. SGLang's guide puts it plainly: under overload, throughput keeps rising or flattens, while goodput peaks and then falls. The peak is the highest load your deployment can carry within its service level objectives (SLOs). The concept comes from the DistServe work that vLLM's docs cite.
Always read percentiles
Averages hide the users who wait. Report p50 and p99 at minimum. Note that vllm bench serve reports only the 99th percentile by default, so add --metric-percentiles 50,90,99 if you want the median too.
A repeatable benchmarking method
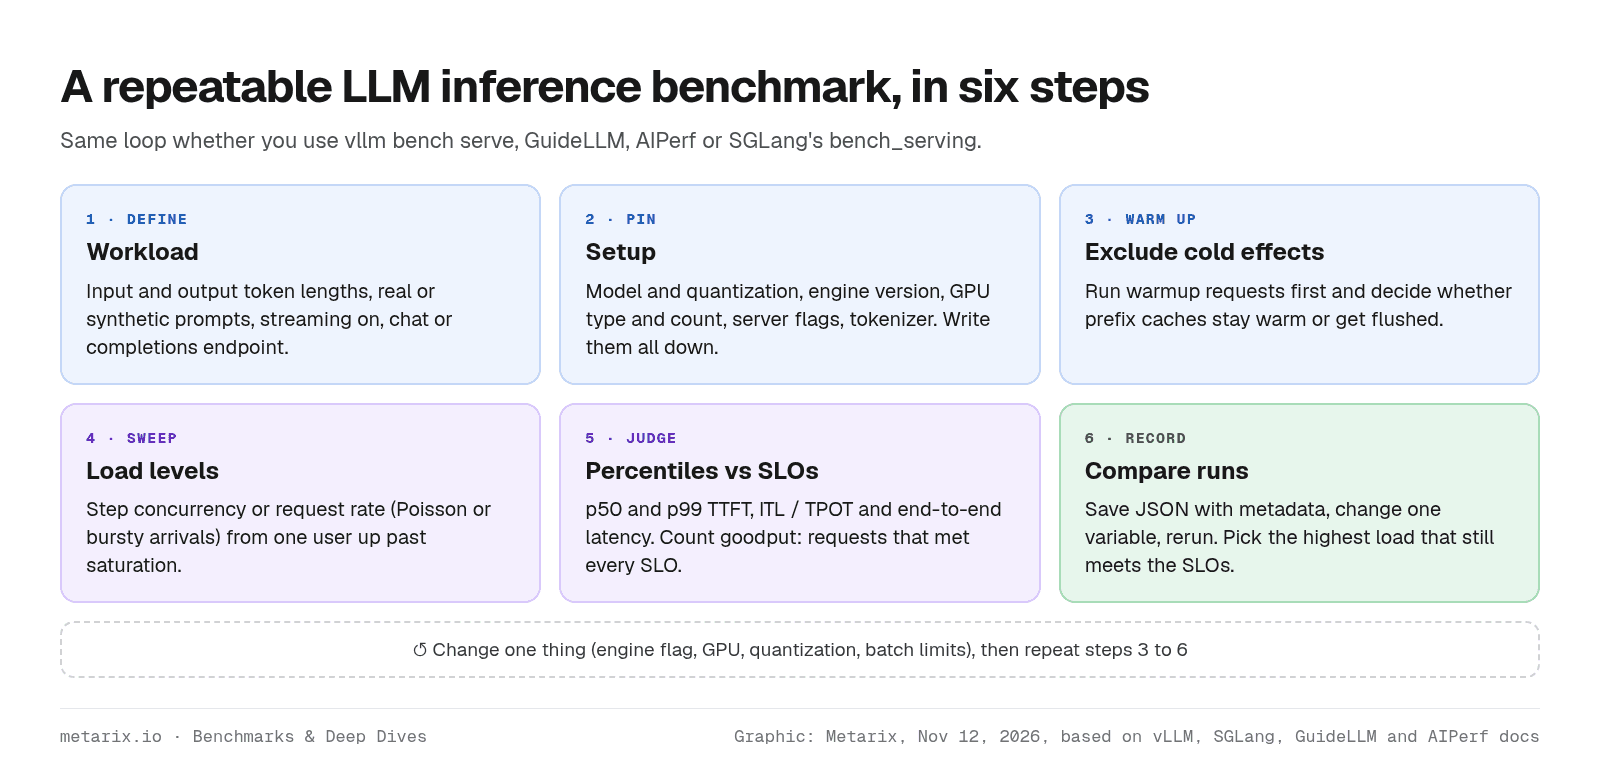
1. Define the workload
Pick input and output lengths that match your product. A RAG or coding-agent workload with 4,000-token prompts and short answers stresses prefill; a chat workload with short prompts and long answers stresses decode. Use your own logged prompts when you can, synthetic prompts with fixed token counts when you can't, and keep streaming on if users see streamed output.
2. Pin the setup
Record the model and quantization, engine and version, GPU type and count, parallelism, server flags and the tokenizer used to count tokens. Most tools can attach this to the result; vllm bench serve has a --metadata flag for exactly this.
3. Warm up
First requests pay for compilation, graph capture and empty caches. vllm bench serve defaults to zero warmup requests (--num-warmups 0), SGLang's script runs one by default, and both GuideLLM and AIPerf have warmup settings. Then decide on caches: SGLang's --flush-cache clears the prefix cache after warmup so you don't accidentally measure warm-cache performance; leave it warm only if production traffic really shares prefixes.
4. Sweep the load
One load level tells you almost nothing. Step concurrency (for example 1, 4, 16, 64) or request rate until latency targets break. Watch the defaults: in both vllm bench serve and SGLang's script, a request rate of inf (vLLM's default) sends every request at once, which measures a burst, not steady traffic. With a finite rate, both use Poisson arrivals, and vLLM's --burstiness switches to a gamma distribution where values below 1 make traffic burstier. GuideLLM automates this with its sweep profile.
5. Judge against SLOs
Write the targets down before you run: for example, p99 TTFT under 1 second and p99 ITL under 50 ms for chat, or p99 end-to-end latency for an agent step. The answer you want is the highest load that still meets them, and the goodput at that load.
6. Record and compare
Save machine-readable results (JSON or CSV), change one variable, and rerun. Treat a result without its workload spec and setup as unusable: the same model can look several times faster or slower with different prompt lengths or concurrency. That is also why public leaderboard numbers rarely transfer to your stack, as our guide on reading LLM leaderboards explains.
The tools in detail
vllm bench serve
vLLM's built-in client is the quickest way to load-test a vLLM server, and it works against other OpenAI-compatible endpoints too. Per its CLI reference, it supports datasets including random, ShareGPT, BurstGPT, Hugging Face datasets, custom files, prefix repetition and timed traces; request rate with Poisson or gamma arrivals; a concurrency cap; probe requests that measure how the main workload stalls unrelated traffic; goodput; and JSON result files. Defaults to know: 1,000 prompts, the random dataset and the /v1/completions endpoint. The benchmarking docs cover the related throughput and latency commands.
Best for: tuning vLLM itself, comparing builds and flags. Watch for: the burst-mode default and p99-only percentiles.
SGLang bench_serving
SGLang's script, run as python3 -m sglang.benchmark.serving, targets SGLang, vLLM, LMDeploy, TensorRT-LLM and OpenAI-compatible routes, according to its guide. It prints request, input and output token throughput, TTFT, ITL and TPOT percentiles, retokenizes outputs to check token counts, and with --goodput adds SLO attainment per target, which shows which SLO is the binding one. It also replays multi-turn agentic traces against chat backends.
Best for: SGLang deployments and head-to-head engine comparisons with the same client. Watch for: turning streaming off makes TTFT equal total latency for chat completions.
GuideLLM
GuideLLM, from the vLLM project, is built around SLO-aware evaluation. Its README lists synchronous, concurrent, throughput, constant, Poisson and sweep profiles; stop constraints by duration, request count, error count and over-saturation; warmup and cooldown; synthetic, Hugging Face and local datasets including synthetic images and video; and JSON, CSV, YAML, HTML and plot outputs. Built-in scenarios package standard shapes such as 1,000 input and 1,000 output tokens.
Best for: capacity planning and reports that non-specialists can read. Watch for: Python 3.11 or newer is required.
AIPerf
AIPerf is NVIDIA's successor to GenAI-Perf, whose README now says it is being phased out. Per the AIPerf README, it reports TTFT, time to second token, ITL, request latency and per-user output throughput with full percentiles, and offers a live dashboard. Its strength is realistic traffic: deterministic trace replay, published production traces, multi-turn coding-agent traces for KV-cache testing, ramping, Poisson and gamma arrivals, and SigV4 signing for IAM-protected AWS endpoints such as SageMaker and Bedrock. Optional extras stream results to MLflow, OpenTelemetry or Weights and Biases.
Best for: agentic and multi-turn workloads, NVIDIA Dynamo and Triton stacks, teams that want telemetry integration. Watch for: many options; start from its basic tutorial.
Hugging Face inference-benchmarker
inference-benchmarker is a Rust tool for OpenAI-compatible chat APIs, with open-loop constant arrival rates, an automatic sweep that finds maximum throughput, preset profiles for chat, summarization and code completion, JSON output, and recipes for Kubernetes and Slurm. Its last tagged release is v1.1.0 from March 28, 2025, although the repository has commits since then.
Older tools: GenAI-Perf and LLMPerf
Many published comparisons used these. LLMPerf is archived and read-only on GitHub; its README notes it counts tokens with a Llama tokenizer regardless of the API being tested, which matters when comparing models with different tokenizers. If your old dashboards come from either tool, re-baseline once with the new tool on the same workload before comparing numbers.
How to choose
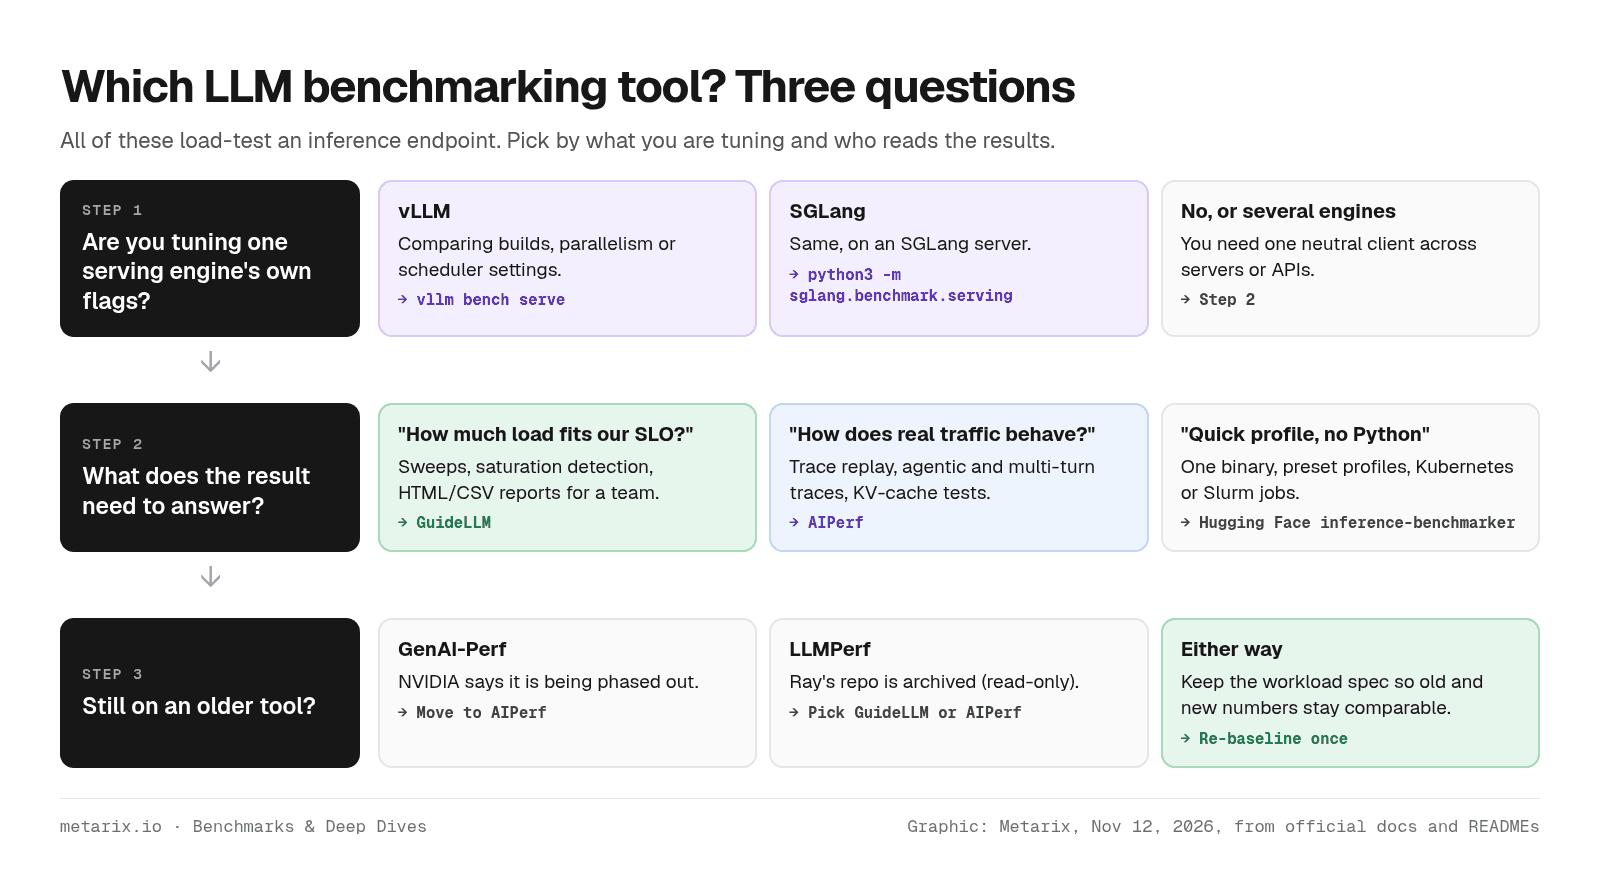
Scroll the table horizontally on smaller screens.
| Situation | Start with | Why |
|---|---|---|
| Tuning vLLM flags, versions or parallelism | vllm bench serve | Zero setup, same project as the engine |
| Tuning SGLang or comparing engines with one client | SGLang bench_serving | Many backends, SLO attainment per target |
| Capacity planning against latency SLOs | GuideLLM | Sweep and saturation detection, readable reports |
| Agentic, multi-turn or production-trace workloads | AIPerf | Trace replay and KV-cache-aware traces |
| Benchmarking from Kubernetes or Slurm without Python | inference-benchmarker | Single binary, preset profiles |
| Comparing hosted APIs before you self-host | Any OpenAI-compatible client above | Same workload spec across providers |
Example: a goodput sweep with vllm bench serve
The commands below are illustrative and were not run for this article; flags are from the vllm bench serve reference as of Nov 12, 2026, so check vllm bench serve --help on your version. They send 500 chat requests with 1,024-token prompts and 256-token outputs at 8 requests per second after 20 warmup requests, and count goodput against a 500 ms TTFT and 50 ms TPOT target.
# Illustrative only: one load level; repeat with other --request-rate valuesvllm bench serve \ --backend openai-chat --endpoint /v1/chat/completions \ --model <your-model> --dataset-name random \ --input-len 1024 --output-len 256 --num-prompts 500 \ --request-rate 8 --burstiness 1.0 --num-warmups 20 \ --percentile-metrics ttft,tpot,itl,e2el --metric-percentiles 50,90,99 \ --goodput ttft:500 tpot:50 \ --save-result --metadata gpu=<gpu> tp=1
The GuideLLM equivalent of a full sweep, taken from its README, is shorter because the tool picks the load levels itself:
guidellm run \ --backend kind=openai_http,target=http://localhost:8000 \ --profile kind=sweep \ --constraint kind=max_duration,seconds=30 \ --data kind=synthetic_text,prompt_tokens=256,output_tokens=128
Mistakes that make benchmarks meaningless
- Measuring a burst and calling it throughput. An infinite request rate fires everything at once. Use a finite rate or fixed concurrency levels.
- Letting outputs end early or run forever. Fixed output lengths need
ignore_eos-style settings; vLLM's--ignore-eosis off by default, while SGLang's script ignores EOS unless you pass--disable-ignore-eos. Real prompts with natural endings give more honest latency but noisier token counts. Pick one on purpose and record it. - Mixing tokenizers. Tokens per second depends on whose tokenizer counts them. Use the model's own tokenizer when comparing models.
- Warm caches by accident. Repeated prompts hit the prefix cache and flatter TTFT. Flush caches or randomize prompts unless your production traffic shares prefixes.
- Running the client on a starved machine. If the load generator runs out of CPU, it adds its own latency. Watch its CPU, or use a tool built for high request volumes.
- Comparing results across different workloads. A 128-token-prompt result and a 4,000-token-prompt result are different experiments, not a ranking.
Benchmark results feed straight into cost decisions. Once you know the load one GPU can carry within your SLOs, you can price it as serverless GPUs or spot and reserved capacity. For quality rather than speed, see our guide to building LLM evals. If you are still choosing a serving engine, our vLLM vs SGLang vs TensorRT-LLM comparison covers how the three differ.
Verdict
Start with the benchmark that ships with your serving engine, because it costs nothing to set up and speaks the engine's language. Move to GuideLLM when you need sweeps and reports that answer "how much traffic can this handle within our SLOs," and to AIPerf when your traffic is agentic, multi-turn or best captured as replayed traces. Retire GenAI-Perf and LLMPerf setups.
More important than the tool: fix the workload, warm up, sweep load, and report p99 latency and goodput with the full setup attached. A single tokens-per-second figure without those is a marketing number, not a benchmark.
Sources
- vLLM docs: vllm bench serve CLI reference (accessed Nov 12, 2026)
- vLLM docs: Benchmark CLI (accessed Nov 12, 2026)
- SGLang docs: Bench Serving Guide (accessed Nov 12, 2026)
- GuideLLM on GitHub (vLLM project) (accessed Nov 12, 2026; latest release v0.8.1, Oct 8, 2026)
- AIPerf on GitHub (NVIDIA ai-dynamo) (accessed Nov 12, 2026; latest release v0.13.0, Sep 24, 2026)
- GenAI-Perf README (NVIDIA) (accessed Nov 12, 2026)
- Hugging Face inference-benchmarker on GitHub (accessed Nov 12, 2026)
- LLMPerf on GitHub (Ray project, archived) (accessed Nov 12, 2026)
- Hao AI Lab: DistServe and goodput (accessed Nov 12, 2026)
Tools covered in this guide
Frequently asked questions
- How do you benchmark LLM inference?
- Run a load generator such as vllm bench serve, GuideLLM or AIPerf against your serving endpoint with a workload that matches production (prompt and output lengths, streaming), warm up first, sweep concurrency or request rate up to saturation, and report p50 and p99 time to first token, inter-token latency and goodput against your latency targets.
- What is goodput in LLM serving?
- Goodput is the number of requests per second that met every latency target you set, such as TTFT under 500 ms and time per output token under 50 ms. Unlike raw throughput, it falls once a server is overloaded, so its peak shows the highest load a deployment can carry within its SLOs. vLLM and SGLang benchmarks both compute it.
- Is GenAI-Perf deprecated?
- NVIDIA's GenAI-Perf README says the tool is being phased out and is no longer getting new features. NVIDIA recommends AIPerf for new performance benchmarking work.
- Which is better, GuideLLM or AIPerf?
- GuideLLM is strongest for SLO-driven sweeps, saturation detection and shareable reports across OpenAI-compatible servers. AIPerf is strongest for replaying real or agentic traffic traces, multi-turn KV-cache tests and NVIDIA-stack deployments. Both are free and open source, and many teams use the engine's own benchmark for quick flag tuning.